Introduction to Anomaly Detection in Fraud Analytics using Isolation Forest
Outline of the blog
-
Introduction : What is Anomaly Detection and what methods are used?
-
Applications of AD in Banking and other payments related businesses
-
Supervised versus Unsupervised methods of Anomaly Detection
-
Challenges in using Big Data for anomaly detection
-
Developing intuition for using Isolation Forest
What is Anomaly Detection and what methods are used?
Anomaly detection, also known as outlier detection, is the process of identifying extreme points or observations that are significantly deviating from the remaining data.
Anomaly is basically the data point of interest because its behavior is different from the rest of the observations in the Dataset.

Applications of AD in Banking and other payments related businesses
Anomaly detection can play a vital role in identification of several known fraud types in various industries. At the same time, it can also help in identifying unknown fraud patterns in the industry.
Common applications of anomaly detection are identification of following industry concerns:
-
Credit card Fraud in retail banking
-
Market abuse in investment banking
-
Insurance claim fraud by Phantom providers
-
Money laundering
Note that each of these applications would require different approaches in terms of data preparation and data modeling because a true fraud label in one application could be noise in another.
Supervised vs Unsupervised Anomaly detection methods
Supervised learning is the scenario in which the model is trained on the labeled data, and trained model will predict the unseen data. Here the main assumption is that we already have true “red Labels” or what we call true fraud labels in our dataset. This is possible in scenarios when fraud is reported out by the victim. For example, a credit card fraud where the customer calls out a certain transaction as being fraudulent.
Some of the modeling techniques:
-
Random Forest
-
SVM
-
Distance based approaches
Unsupervised Anomaly detection is a scenario where there is no means to separate out noise and normal data points from the dataset. In industry, in most of the cases, the fraud labels are not available or even if available, we don’t know whether it is a true positive label or not.
For example, in money laundering in investment banking, the frauds are hard to trace and since there is a lot of drift in terms of time component involved, unsupervised AD becomes the obvious choice of modeling technique.
Challenges in using Big Data for anomaly detection
Before we get started with Isolation forest, let’s talk about few challenges other than data preparation in anomaly detection using unsupervised ML techniques.
Contrary to the general perception that more the amount of data, better the model would perform, when it comes to anomaly detection using let’s say single class SVM or K-Means clustering, there is a high possibility that we end up predicting a normal data point as anomaly and an anomaly as a normal data point. Strange?
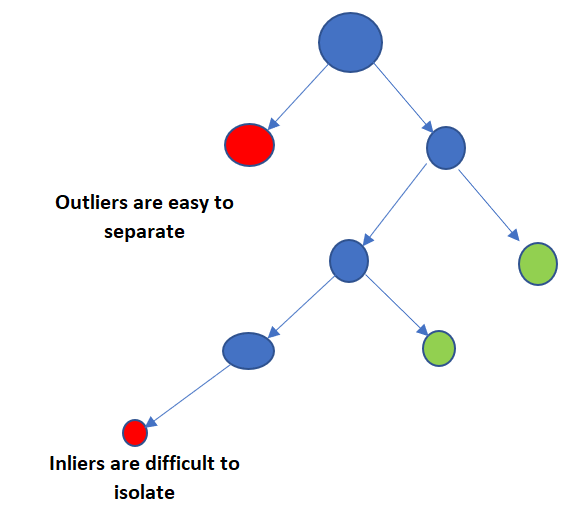
In the above decision tree, it is difficult to isolate the anomaly points which lie at a very high depth leaf node.
Let’s add some technical terminology to illustrate what I just talked about.
Swamping
Since anomalies are very rare events ( ~0.1 % to 1% ), it makes it very difficult for any machine learning algorithm to predict this rare class with very high accuracy. Swamping is a phenomenon of labelling a normal point as anomaly. The problem becomes graver, when an action or investigation is triggered basis this faulty model and businesses loose trust in such anomaly detection engines.
“It is better 100 guilty Persons should escape than that one innocent Person should suffer”- Benjamin Franklin
Masking
In this phenomena, the anomaly points are classified as normal data points by the model. This issue is more prevalent when using clustering algorithms to identify anomalies and the fraud clusters get merged with normal data point clusters.
Any anomaly detection should be immune to both swamping and masking.
Isolation Forest
Isolation Forest is an ensemble regressor and it uses the concept of isolation to explain or what we call separate away anomalies from normal data points. It does not rely upon any data profiling or point based distance calculation ( spatial distance approach ), instead, Isolation forest (IF) builds an ensemble of highly randomized trees for a given data set and defines anomalies as the points with shortest average path lengths.
There are already few articles/blogs on the working of the Isolation Forest algorithm.
You can read more about it here
How Isolation forest handles swamping and masking?
Isolation forest does a wonderful job in minimizing the impact of swamping and masking by making use of subsampling techniques.
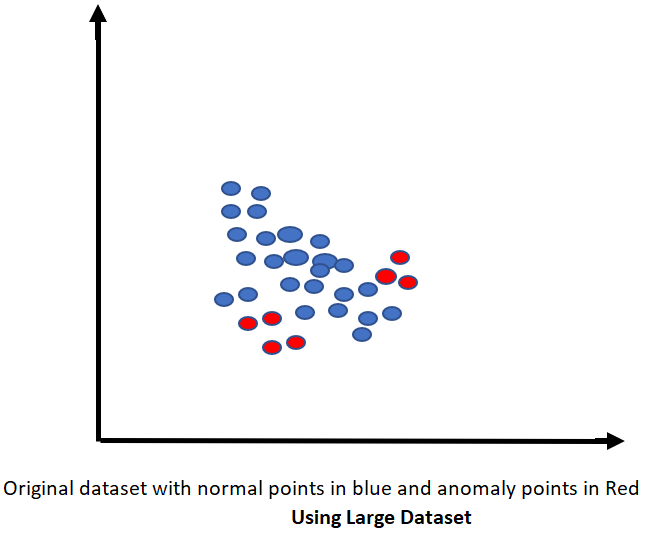
Let’s first evaluate the challenges with large datasets. When the size of dataset is huge, the normal instances which constitute more than 99% of the training data might lie very close to the anomaly points and would be very difficult to establish any boundary line to isolate anomaly points. When the data size is huge, each tree within IF is forced to undergo multiple partitions to identify path of anomaly points and ends up calculating an overall higher path length. This results in the problem called masking.
The Below scatter plot explains the issues associated with using large dataset.
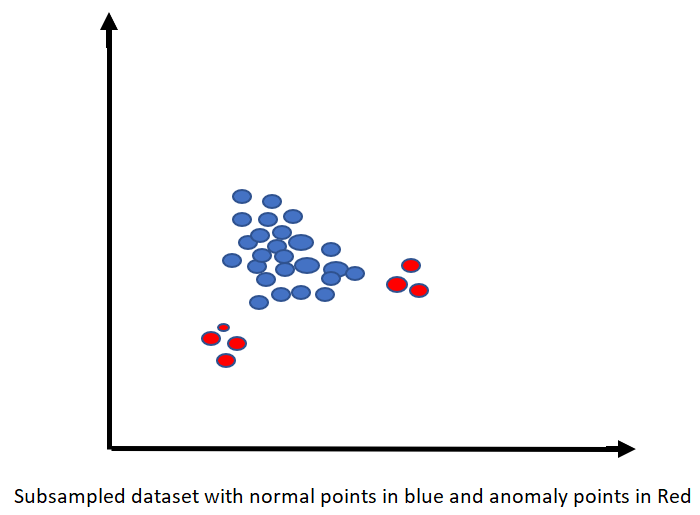
Here subsampling comes to our rescue. Since each tree within the ensemble Isolation forest grows using different subsample of data. Assuming each sample to be highly randomized in nature, each individual tree can capture different anomaly points in the overall population. Subsampling helps in removing clutter and a mix of normal and anomalous instances.
The Below plot demonstrates how subsampling helps in isolating anomaly points from the normal population
So, the number of subsample and sample size becomes a very interesting and at the same time very important hyper parameter while tuning an Isolation Forest. In future blogs, I will try to compare performance of same Isolation forest with different subsample sizes.
The intention of this blog was not to cover the complex mathematical part of the algorithm where I would have loved to talk about calculation of path length and other thresholds and other underlying subtopics.
Here I wanted to develop an intuition about IF as an anomaly detection algorithm and introduce the concepts of swamping and masking and their impact on AD models in general.
References:
-
https://blog.paperspace.com/anomaly-detection-isolation-forest/
-
http://www.matias-ck.com/files/papers/Extended_Isolation_Forest.pdf
-
https://medium.com/walmartlabs/swamping-and-masking-in-anomaly-detection-how-subsampling-in-isolation-forests-helps-mitigate-bb192a8f8dd5