Feature Engineering Guide
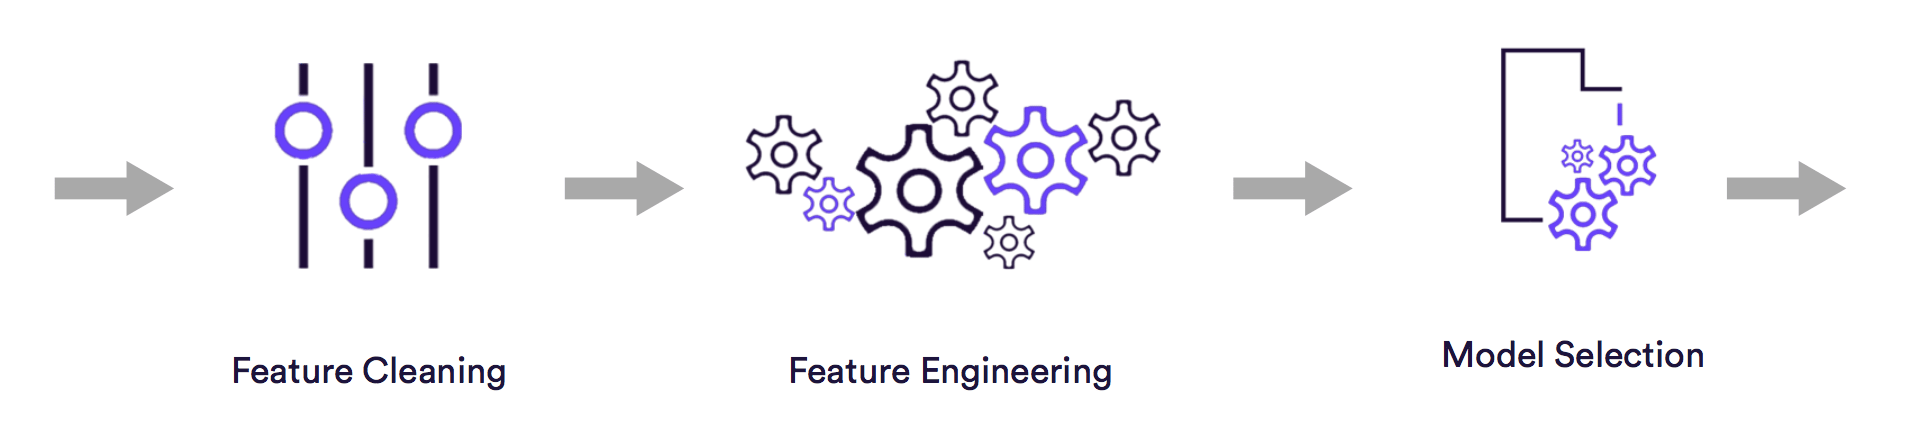
Feature Engineering
Feature engineering is an informal topic, but one that is absolutely known and agreed to be key to success in applied machine learning.Feature engineering is the process of using domain knowledge to extract features from raw data via data mining techniques. These features can be used to improve the performance of machine learning algorithms.
Feature engineering is another topic which doesn’t seem to merit any review papers or books, or even chapters in books, but it is absolutely vital to ML success. Much of the success of machine learning is actually success in engineering features that a learner can understand - Scott Locklin
The aim of this blog is to walk users through the commonly used features in building regression and binary classification models
For different types of problem statements and modelling techniques, the choice of variables and feature selection varies.
For Regression based models, we might be interested in building aggregated views of certain continuous independent variables using history data. Lets we want to predict daily sales of a retailer. Here average number of customers for last 1 month for each week of the day could become an important predictor.
For classification based models, we might be interested in introducing event based features to help the model focus on variables which might be helpful in explaining maximum variance and patterns in the data.
Types of Features
Risk
Risk in general terms means the probablity that an event will happen.An Event could be a claim denial, Getting or not getting a call in call center analytics, An overpayment on a claim and so on.In all our binary classification problems, we tend to build risk features one way or the other. Generally Data Scientists build risk feature as simple as ratio of all to sum of and .
But isn’t it wrong?
Lets say we have 2 doctors
- Doctor A fills 100 claims out of which 10 were having overpayment. Simple Event rate risk would be 0.1.
- Doctor B Fills 2 claims out of which 1 had overpayment. Risk for Doctor B would be 0.5.
Don’t you think, we should be focusing more on Doctor A than Doctor B?
There should be some smoothening factor associated while calculating risk which should consider entire population while computing risk
Lets introduce a new formula for calculating Risk
where is the count of observations where an event happened for category,
is the count of total observations where that category occured,
is the count of observations where an event happened in overall training dataset,
is the count of total observations in the training datset
Using the above formula, lets evaluate the risks for the two doctors under experiment
If you noticed, risk value for A was not affected much but risk for B was reduced significantly and at same time was still higher than A. This way, we not only smoothen the risk value but also carry the essence of the actual risk
Further, think about seasonality and how it could generate outliers in the risk calculation. To mitigate impact of seasonality on our risk calcualtion, its always recommended to calculate these matrices using a history of data. The amount of history could vary from project to project depending upon patterns in the data. Like in 1 project, operational changes occur quarterly, then a 3 months lookback would be able to pick all sorts of seasonal patterns.
When to Choose Risk over the value itself?
Well, generating such risk features could increase the model lifecycle and save you from regular model maintenance or refresh activity Lets say you have categorical variable “Member State”. Considering low cadinality of this field say 50, one could pass this variable as such to the model. But 1 year from model deployment, new states could begin to appear in the data and the model would start imputing them. What if the new states had an higher risk associated with them but model would treat all new fields as same i.e. Unknown value. If one uses Risk of Member State as a feature, then no matter how many new values appear in the data, we would be exposing a numeric value to the model which would be risk associated with a new state
Periodic refresh of these Risk features helps the “Deployed” production model to learn new variations in the input dataset and give more accurate and precise results
Missing Value Imputation
It is generally recommended to impute missing values with the overall risk value for the month
Entropy
Entropy is a measure of uncertainty or randomness associated with a feature. A more stable system would have Zero Entropy whereas a highy volatile system would have a very high entropy value.
where is maximum number of child column values across which occured for a parent column.
defines frequency at which parent column occured
defines the frequency at which parent column and child column interaction occured
In machine learning, the rationale behind using entropy feature is that it helps to identify abnormalities or surprise element associated with certain obervations or records in the data under observation.
Lets take a small example to build intuition for when to use Entropy Features.
Lets say, we have a data for all the general practitioners operating in United States. In an ideal case scenario, 1 doctor would be operating in only 1 state or max 2. This would be general trend for most of the providers.
A higher Entropy of Doctor Name over State means that a certain doctor is operating in a large # of states of US which is not really possible for a general practitioner right!.
Missing Value Imputation
It is generally recommended to impute missing values with the overall median value for the month. Generally, it is 0 value or a value very close to 0. So, its also safe to impute it with 0 value
Lookback
In most of our projects, we tend to compute certain aggregations like mean, max,min,count of certain continuous features/columns. Lookback here means that we would be using a certain history data in a dynamic fashion to calculate these aggregations
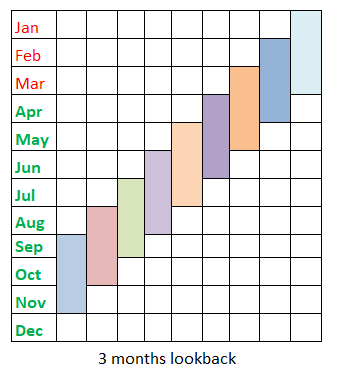
In the above trend chart, for calculating count of claims for december month, I would use Sept - Nov Data and so on. Here, Jan- Mar data() is used to calcuate lookback features for april month. Since, there are not enough observations for calculating lookback for these 3 months, we would remove this data while model development
Stay Tuned for –
There are alot of additional features which Data Scientists build specific to their project requirement and business requirement. We look forward to feedback and information about additional features which might be helpful to the larger team.
In the next tutorial, I plan to cover the implementation of different types of features in PySpark and discuss about the different normalization techniques and their inplementation in PySpark
End of the Document
I would appreciate your feedback, suggestion on how I can improve this.