PySpark By Example
Flow of the blog
- Basic terminology associated with PySpark
- Basic commands of PySpark
- Using SQL in PySpark
- Using Pandas and Spark operations on the same data frame
- Data Compression Techniques
- Code optimization techniques - Repartitioning & Caching
- Complex programs such as PCA
Apache Spark
Apache Spark™ is a unified analytics engine for large-scale data processing. Apache Spark is an open-source distributed general-purpose cluster-computing framework. Spark provides an interface for programming entire clusters with implicit data parallelism and fault tolerance. It provides high-level APIs in Java, Scala, Python and R As compared to the disk-based, two-stage MapReduce of Hadoop, Spark provides up to 100 times faster performance for a few applications with in-memory primitives. Fast performance makes it suitable for machine learning algorithms as it allows programs to load data into the memory of a cluster and query the data constantly
Basic Spark Computing Framework

PySpark
PySpark is a Python API to support Apache Spark. In a PySpark code, developers have the liberty to use Spark, Python, SQL commands hence makes it a perfect programming language for machine learning development If you’re already familiar with Python and libraries such as Pandas, then PySpark is a great language to learn in order to create more scalable analyses and pipelines
Before, we get started with the basics of PySpark programming, let’s discuss some key terms associated with Spark framework.
Resilient Distributed Datasets (RDD)
RDD’s are a collection of data items that are split into partitions and can be stored in memory on workers nodes of the spark cluster. In terms of datasets, apache-spark supports two types of RDD’s - Hadoop Datasets which are created from the files stored on HDFS and parallelized collections which are based on existing Scala collections. Spark RDD’s supports two different types of operations - Transformations and Actions.
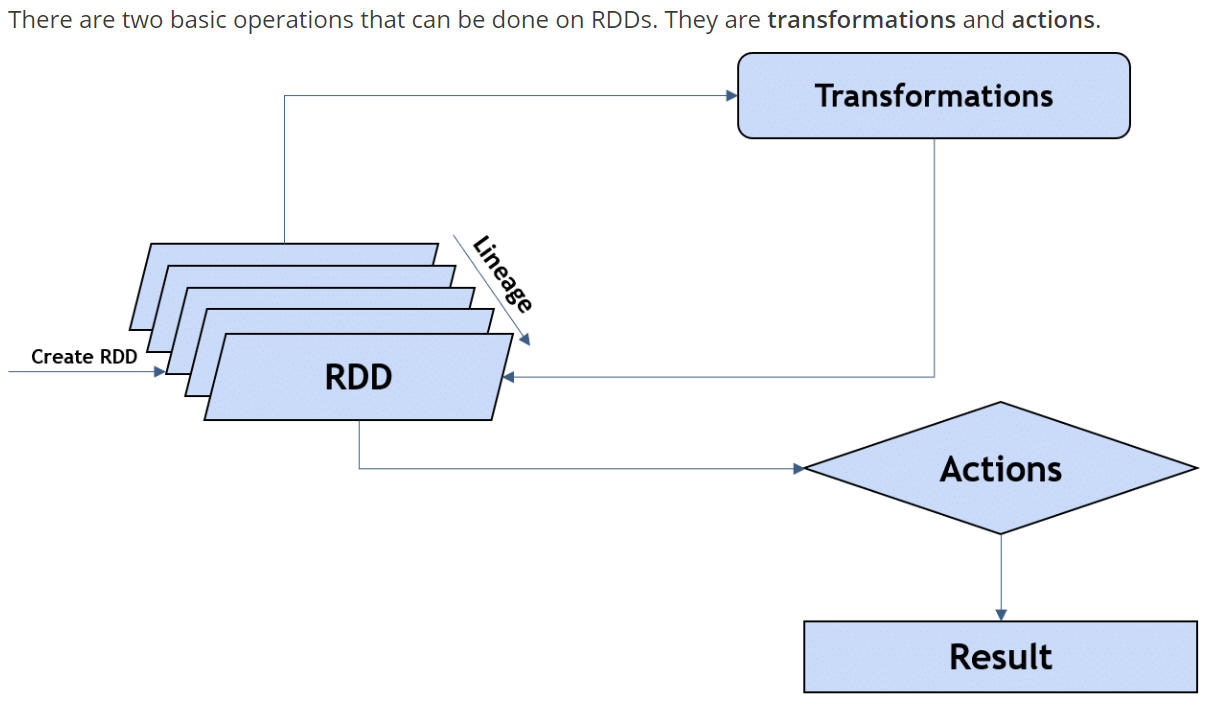
Lazy Evaluation
As the name itself indicates its definition, lazy evaluation in Spark means that the execution will not start until an action is triggered. For example, we filter a dataset. The filtering will not actually take place until the user expects the output such as Count after filtering or exporting the filtered dataset to disk.
Action
Spark Action is the operation where Spark will actually compute the underlying flow of the sequence. Let’s say exporting the results of a spark function , printing top rows of a dataframe or as simple as a count statement where User expects the output in one form or the other. To better understand the concept of Lazy Evaluation and Action, let’s take an example of the following code
import time
### Load a csv file as spark dataframe
df = spark.read.format("csv").option("header", "true").load("09_inventory.csv")
Lazy Evaluation
t1 = time.time()
###### Lazy Evaluation ###################
df_filtered = df.filter(df("state") === "OH")
t2 = time.time()
print(t2-t1)
4.673004150390625e-05
Action
t3 = time.time()
df_filtered.count()
t4 = time.time()
print(t4-t3)
6.0064146518707275
Basic Spark operations
Reading a Flat file
df_input = spark.read.format("csv").option("header", "true").load("09_Inventory.txt",sep='\t')
type(df_input)
pyspark.sql.dataframe.DataFrame
#### Instead of Head() function in Python , we have Show() function to print top N rows.
#### Second Argument "False" is optional and it allows to print the entire column contents instead of pruning to fit col width
df_input.show(2,False)
+----------+--------+--------------+-----------------+----------------------------------+----------------------+-------+-----------+
|Order Date|Order ID|Order Quantity|Product Container|Product Name                      |Product Sub-Category  |Sales  |Ship Mode  |
+----------+--------+--------------+-----------------+----------------------------------+----------------------+-------+-----------+
|1/27/2007 |24544   |31            |Medium Box       |Canon MP41DH Printing Calculator  |Office Machines       |6567.00|Express Air|
|1/27/2007 |24544   |39            |Large Box        |Fellowes Neat Ideas� Storage Cubes|Storage & Organization|1780.00|Regular Air|
+----------+--------+--------------+-----------------+----------------------------------+----------------------+-------+-----------+
only showing top 2 rows
Adding a New column to existing Spark dataframe
withColumn()
from pyspark.sql.functions import col , round
df_input = df_input.withColumn("Cost_per_order",round((col("Sales")/col("Order Quantity")),2))
df_input.show(2)
+----------+--------+--------------+-----------------+--------------------+--------------------+-------+-----------+--------------+
|Order Date|Order ID|Order Quantity|Product Container|        Product Name|Product Sub-Category|  Sales|  Ship Mode|Cost_per_order|
+----------+--------+--------------+-----------------+--------------------+--------------------+-------+-----------+--------------+
| 1/27/2007|   24544|            31|       Medium Box|Canon MP41DH Prin...|     Office Machines|6567.00|Express Air|        211.84|
| 1/27/2007|   24544|            39|        Large Box|Fellowes Neat Ide...|Storage & Organiz...|1780.00|Regular Air|         45.64|
+----------+--------+--------------+-----------------+--------------------+--------------------+-------+-----------+--------------+
only showing top 2 rows
Rename an existing column
df_input = df_input.withColumnRenamed("Order Quantity","Order_Quantity_renamed")
df_input = df_input.withColumnRenamed("Product Container","Product_Container")
df_input = df_input.withColumnRenamed("Ship Mode","Ship_Mode")
df_input
DataFrame[Order Date: string, Order ID: string, Order_Quantity_renamed: string, Product_Container: string, Product Name: string, Product Sub-Category: string, Sales: string, Ship_Mode: string, Cost_per_order: double]
Basic Aggregation operations
from pyspark.sql.functions import count, avg,col,min,max,mean, sum as sumf
df_rolled_up = df_input.groupBy(["Product_Container"]).\
 agg(\
 sumf("Sales").alias("Sum_sales"),\
 mean("Cost_per_order").alias("Mean_cost")\
 )
df_rolled_up.show(3)
+-----------------+---------+------------------+
|Product_Container|Sum_sales|         Mean_cost|
+-----------------+---------+------------------+
|        Small Box|8246744.0|  85.2778485665278|
|        Large Box|3197166.0| 545.6350529100528|
|       Medium Box|1165242.0|224.70029069767432|
+-----------------+---------+------------------+
only showing top 3 rows
## CROSS TAB
df_input.crosstab('Product_Container','Ship_Mode').show()
+---------------------------+-----------+-----------+------------+
|Product_Container_Ship_Mode|Express Air|Regular Air||Express Air|
+---------------------------+-----------+-----------+------------+
|                  Large Box|         55|        323|           0|
|                 Medium Box|         50|        294|           0|
|                  Small Box|        568|       3513|           0|
|                  Jumbo Box|          0|          0|         490|
|                 Jumbo Drum|          0|          0|         573|
|                 Small Pack|        113|        781|           0|
|                   Wrap Bag|        135|        958|           0|
+---------------------------+-----------+-----------+------------+
Joining Spark Dataframes
Just like in Pandas or normal SQL querying , we tend to join dataframes, this can also be done very easily using Spark.
Syntax : Output Data Frame = First_DataFrame.join(second_DataFrame>,on=[List of joining keys],how=(join type))
df_join = df_input.join(df_rolled_up, on=['Product_Container'], how="left")
df_join.show(3)
+-----------------+----------+--------+----------------------+--------------------+--------------------+-------+------------+--------------+---------+------------------+
|Product_Container|Order Date|Order ID|Order_Quantity_renamed|        Product Name|Product Sub-Category|  Sales|   Ship_Mode|Cost_per_order|Sum_sales|         Mean_cost|
+-----------------+----------+--------+----------------------+--------------------+--------------------+-------+------------+--------------+---------+------------------+
|       Medium Box| 1/27/2007|   24544|                    31|Canon MP41DH Prin...|     Office Machines|6567.00| Express Air|        211.84|1165242.0|224.70029069767432|
|        Large Box| 1/27/2007|   24544|                    39|Fellowes Neat Ide...|Storage & Organiz...|1780.00| Regular Air|         45.64|3197166.0| 545.6350529100528|
|       Jumbo Drum| 1/27/2007|   24544|                    15|Global Stack Chai...|  Chairs & Chairmats| 578.00||Express Air|         38.53|5382756.0|463.28827225130897|
+-----------------+----------+--------+----------------------+--------------------+--------------------+-------+------------+--------------+---------+------------------+
only showing top 3 rows
Here I have joined the dataframes using Left join, You can use Right/Inner and all other types of join conditions which you otherwise find in other programming languages.
Spark-SQL
Sometimes, while performing data transformations or while writing complex feature engineering codes, we wonder that if we could use SQL here, we would have done this very easily and quickly. Pyspark got this enabled for you via its Spark-SQL API
Let’s try to write some SQL queries using the above Spark table as the underlying SQL Table
# sql_demo = spark.sql('''
# select Product_Container,sum(Sales) as Sales_sum,
# mean(Cost_per_order) as mean_cost
# from df_input
# group by Product_Container
# order by Product_Container
# ''')
The above-Commented query would give this Error
-
- *Py4JJavaError: An error occurred while calling o38.sql.
- org.apache.spark.sql.AnalysisException: Table or view not found: df_input; line 4 pos 21*
This is because, we did not register our spark dataframe as a SQL table.
Following command would register the table to be used in SQL queries
SparkDataframe.createOrReplaceTempView(“View Name”)
df_input.createOrReplaceTempView("View1")
## Now we can use View1 in place of df_input in our sql queries
sql_demo = spark.sql('''
 select Product_Container,sum(Sales) as Sales_sum,
 mean(Cost_per_order) as mean_cost
 from View1
 group by Product_Container
 ''')
sql_demo.show(3)
+-----------------+---------+------------------+
|Product_Container|Sales_sum|         mean_cost|
+-----------------+---------+------------------+
|        Small Box|8246744.0|  85.2778485665278|
|        Large Box|3197166.0| 545.6350529100528|
|       Medium Box|1165242.0|224.70029069767432|
+-----------------+---------+------------------+
only showing top 3 rows
type(sql_demo)
pyspark.sql.dataframe.DataFrame
Note: The output of a Spark-SQL is again a Spark data frame and requires registry as SQL table before being used in any SQL query
Few thoughts on Spark-SQL
- The Spark SQL function accepts only String Input
- What this means for us is that whatever automation we can apply on strings can be directly applied to this spark SQL function. For example, a Where clause in a SQL query might come as an interaction variable from a FOR Loop
- Encapsulating a SQL query within a Python code just makes it a great combination of Python and SQL. This enables us to leverage Python Language and at the same time, make use of SQL programming within a Python code without using any JDBC/ ODBC/SSH connection
Reading & Writing a HDFS / SQL / Hive Table in PySpark
Write Spark DF as Hive Table
spark.sql("create table inventory_data1 as select * from View1")
DataFrame[]
df_subset = df_input.select("Product_Container")
Write to a ORC Compressed HDFS File
df_subset.write.mode("overwrite").orc(HDFS_PATH+"inventory_data.orc")
Reading an ORC File
df_orc_read = spark.read.orc(HDFS_PATH+"inventory_data.orc")
Reading a SQL / Hive Table
df_sql_read = spark.sql('select * from dbo.inventory_data')
Pandas to and Fro
#Convert a Spark dataframe to a Pandas DF
t1 = time.time()
df_pandas = df_input.toPandas()
t2 = time.time()
print("Time taken for conversion Spark Dataframe to Pandas Dataframe")
print(t2-t1)
Time taken for conversion Spark Dataframe to Pandas Dataframe 3.4181530475616455
t1 = time.time()
df_spark = spark.createDataFrame(df_pandas)
t2 = time.time()
print("Time taken for conversion to Pandas Dataframe to Spark Dataframe")
print(t2-t1)
Time taken for conversion to Pandas Dataframe to Spark Dataframe 36.537726163864136
Few Thoughts on toPandas() Function
This operation comes handy when we have reduced our data size during the pre-processing phase and later steps can be easily computed using Python - Pandas operation. But, this conversion is a very computationally expensive operation and should be avoided to keep the runtime low.
Repartitioning & Caching in Spark
The main advantage of Spark is its faster and scalable computation as compared to other Hadoop based distributed frameworks like Map-Reduce. Along with this, Spark provides a lot of flexibility to the User in the form of user commands using which users can speed up the queries. This becomes very prudential while working with big datasets stored as partitioned flat files with irregular partition size.
Let’s take an example of a server which maintains daily visitor details for a shopping mall partitioned at Date Level. It is very obvious to have irregular partition size with more big partitions for weekends over weekdays. Map-Reduce does not adjust these irregular partition sizes resulting in few mappers lagging behind others.
Repartitioning Spark DataFrame
The default partition size is 200 in PySpark. What this means is - Let’s say you load a dataset with 1000 partition of irregular/ Regular size, spark will reduce the partition count to 200 resulting in bigger/smaller output partition size depending upon input partition size.
Input Data
Output Spark Dataframe
Repartioning is a doube ended sword. In the above example, higher partition size could result in Executor memory exceeded error if the executor core memory is less than 500MB
In such cases, there is merit in increasing the partition count and ultimately reducing the partition size
Data_repartioned = Dataframe.rdd.repartition(n)
n = df_input.getNumPartitions()
print("Number of partitions before repartitioning:")
print(n)
df_repartitioned = df_input.repartition(200)
n = df_repartitioned.getNumPartitions()
print("Number of partitions After repartitioning:")
print(n)
The number of partitions before repartitioning: 1000 The number of partitions After repartitioning: 200
Caching a Data Frame
At this point, we understand the flow of the Spark code. Also, we are familiar with the concept of Lazy Evaluation and Action. Spark doesn’t load any data from the disk unless an Action requires that data. What this means is that even if the same spark dataframe might be called for action 100 times, Spark would consider all 100 actions as different. So, there could be a huge gain if we can somehow load this dataframe in our Cache Memory ( Fastest memory in CPU ), then imagine how fast our code would become. This can be achieved by Caching that dataframe in the spark cluster by using cache() command. For a successful cache operation , a action command such as count , show must follow a cache command
import time
t1 = time.time()
df_input.count()
t2 = time.time()
print("Time Taken first time"),
print(t2-t1)
t1 = time.time()
df_input.count()
t2 = time.time()
print("Time Taken second time")
print(t2-t1)
Time Taken first time 0.5687005519866943 Time Taken second time 0.5017709732055664
Lets Cache this df_input Dataframe
t1 = time.time()
df_input.cache()
t2 = time.time()
print("Time Taken to Cache dataFrame")
print(t2-t1)
print("Data Cached")
Time Taken to Cache dataFrame 0.002241849899291992 Data Cached
t1 = time.time()
df_input.count()
t2 = time.time()
print("Time Taken for action after cache")
print(t2-t1)
Time Taken for action after cache 0.1483006477355957 See the run-time reduction in our count command execution after caching the data
Please also explore Persist command and Coalesce commands and contemplate when to use them over cache and Repartition
Complex Data Operations using PySpark
PCA Implementation in PySpark
Load necessary modules from ml / mllib library for implementing PCA. I will try to cover the UDFs in this module. Hence I have written the UDF for computing PCA in PySpark.
from pyspark.ml.feature import VectorAssembler
from pyspark.ml.feature import PCA as PCAml
from pyspark.ml.linalg import Vectors
from pyspark.sql.types import LongType
from pyspark.sql import Row
from functools import reduce
def pca_function(base_table,Numeric_col,k):
    '''
    base_table : Spark DataFrame
    Numeric_col : Parse the numeric column names using which PCA needs to be computed
    k : Number of Principle components to be computed
    '''

    Numeric_col_list = Numeric_col ##Parse the numeric column names using which PCA needs to be computed
    temp_table = base_table
    k_value = k ## this contains the of principle components requested
    Var_table=temp_table.select(Numeric_col_list)
    Var_table = Var_table.fillna(0)
    assembler = VectorAssembler(inputCols=Var_table.columns, outputCol="features")
    if k>len(Numeric_col_list):
        k=len(Numeric_col_list)
    elif k==0:
        print("PLease pass positive non zero value")
        return None
    var_rdd = assembler.transform(Var_table).select("features")
    pca = PCAml(k=k, inputCol="features", outputCol="pca")
    model = pca.fit(var_rdd)
    transformed = model.transform(var_rdd)
    pca_df = transformed.select('pca').rdd.map(lambda x: x[0].toArray().tolist()).toDF()
    oldColumns = pca_df.schema.names
    newColumns=["Prin_comp"+w for w in pca_df.schema.names]
    pca_final = reduce(lambda pca_df, idx: pca_df.withColumnRenamed(oldColumns[idx], newColumns[idx]), range(len(oldColumns)), pca_df)
    if "index" in temp_table.schema.names:
        print("schema_already_contains_index")
        temp_table = temp_table.drop(*["index"])
    schema_new = temp_table.schema.add("index", LongType(), False)
    df1_index =  temp_table.rdd.zipWithIndex().map(lambda l: list(l[0]) + [l[1]]).toDF(schema_new)
    schema_new = pca_final.schema.add("index", LongType(), False)
    df2_index =  pca_final.rdd.zipWithIndex().map(lambda l: list(l[0]) + [l[1]]).toDF(schema_new)
    #df1_index = zipindexdf(base_table)
    #df2_index = zipindexdf(pca_final)
    Var_table1 = df1_index.join(df2_index, "index", "inner")
    Var_table1 = Var_table1.drop("index")
    return Var_table1
help(pca_function)
Help on function pca_function in module __main__:

pca_function(base_table, Numeric_col, k)
    base_table : Spark DataFrame
    Numeric_col : Parse the numeric column names using which PCA needs to be computed
    k : Number of Principle components to be computed
PySpark is a library that has matured a lot in the last 2 years and now it allows end to end machine learning pipeline. Starting from data loading to data wrangling to model development, everything can be done in PySpark.
On top of this, PySpark is also capable of simulating famous ML Libraries such as H2O as Sparkling Water API
I personally find PySpark very handy as it allows me to write all my codes in 1 language by leveraging different data sources such as SQL/ Hive / Flat files. Users can write a lot of executor level UDFs hereby reducing the runtime significantly
End of the Document
Stay tuned for more such interesting blogs. Till then, Stay Safe & Happy Coding